Bitcoin Rainbow Chart predicts BTC for March 1, 2026 
![]() Cryptocurrency Feb 16, 2026 Share
Cryptocurrency Feb 16, 2026 Share
The latest projection from the Bitcoin (BTC) Rainbow Chart suggests the asset could trade in a wide range between $41,882 and $459,303 by March 1, 2026.
This outlook comes as Bitcoin continues to face key rejections amid a broader cryptocurrency market correction. At press time, the asset was trading at $68,508, down 2.5% in the past 24 hours and about 0.3% on the weekly timeframe.
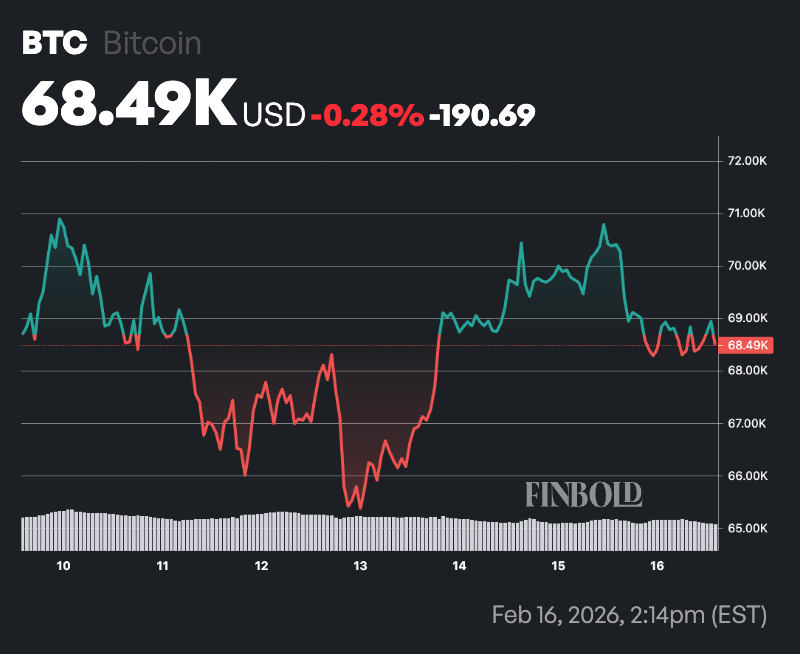 Bitcoin seven-day price chart. Source: Finbold
The Rainbow Chart is a long-term valuation framework rather than a short-term timing tool. Based on current prices and past cycle trends, it indicates notable upside potential over the next year, ranging from steady gains to a possible late-cycle surge depending on market momentum.
Bitcoin price prediction
For March 1, the lowest band, ‘Basically a Fire Sale,’ ranges from $41,882 to $54,704 and signals extreme undervaluation where long-term investors have historically stepped in aggressively.
Above that, the ‘BUY’ zone spans $54,704 to $73,737, indicating strong value territory with favorable risk-reward conditions. The ‘Accumulate’ band, between $73,737 and $95,191, reflects relatively cheap pricing within the broader cycle, often associated with steady long-term positioning.
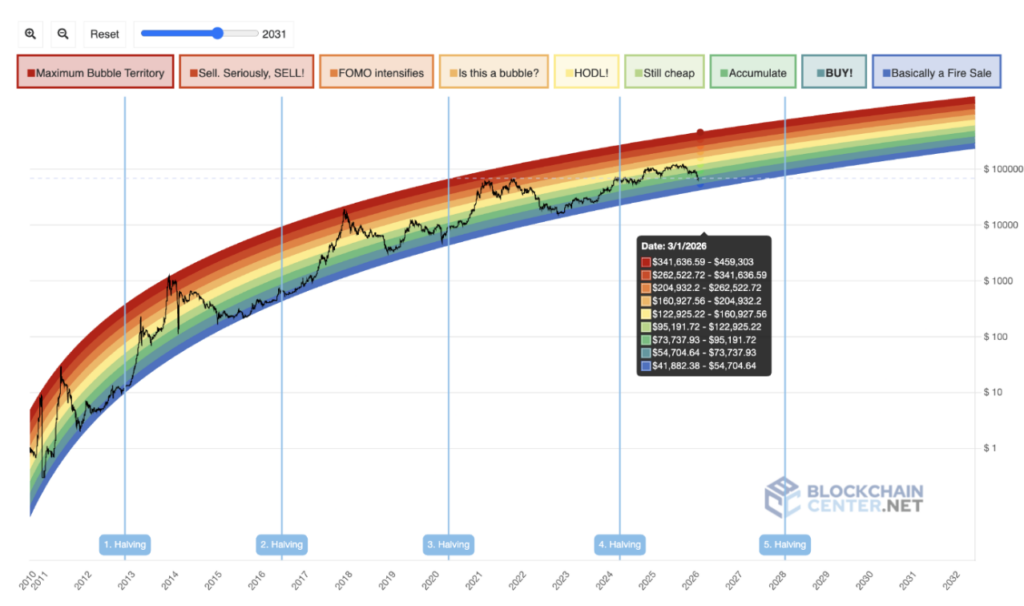 Bitcoin Rainbow chart. Source: BlockhainCenter
At the same time, the ‘Still Cheap’ range extends from $95,191 to $122,925, suggesting Bitcoin remains undervalued but no longer deeply discounted.
The ‘HODL’ zone, from $122,925 to $160,927, represents fair value within a bullish cycle where holding, rather than aggressive buying, has historically been favored.
The ‘Is This a Bubble?’ band runs from $160,927 to $204,932, indicating rising speculative enthusiasm and elevated valuations. Meanwhile, the ‘FOMO Intensifies’ range, between $204,932 and $262,522, signals accelerating investor excitement and momentum-driven buying.

The Economics of the Global Online Gambling Business – How Big is it Really?
The global online gambling business is huge. Estimates placed the 2025 market at being worth around $78 billion a year, … Continue reading
Featured Sponsored Feb 16, 2026
The ‘Sell. Seriously, SELL!’ zone spans $262,522 to $341,636 and has historically been associated with late-cycle euphoria and heightened correction risk.
At the top, ‘Maximum Bubble Territory’ ranges from $341,636 to $459,303, reflecting extreme overvaluation conditions that have previously preceded major reversals.
Bitcoin’s possible price for March 1
With Bitcoin trading at $68,508 on February 16, it currently sits within the ‘BUY’ region based on the March 2026 forward curve, slightly above the lower accumulation threshold.
If Bitcoin follows the model’s mid-range trajectory, a move toward the ‘HODL’ or ‘Is This a Bubble?’ zones would imply a price between roughly $122,000 and $200,000 by March 1, 2026.
A full speculative cycle similar to prior halving-driven rallies could push prices into the $260,000 to $340,000 range, while an extreme euphoric phase would require a surge toward or above $400,000.
Conversely, if macroeconomic pressure or weakened demand slows the cycle, Bitcoin could remain below $95,000 in early 2026, keeping it within the accumulation bands rather than entering overheated territory.
Featured image via Shutterstock