Bitcoin set for a major 15% move, expert predicts 
![]() Cryptocurrency Feb 18, 2026 Share
Cryptocurrency Feb 18, 2026 Share
A cryptocurrency analyst has suggested that Bitcoin (BTC) is setting up for a possible 15% move in either direction as the asset continues to stall below the $70,000 mark.
In this line, insights by Ali Martinez suggest that Bitcoin is consolidating within a tightening symmetrical triangle, a setup that often precedes a significant breakout.
In an X post on February 18, the expert said the market is preparing for a potential 15% move as price action compresses toward the apex.
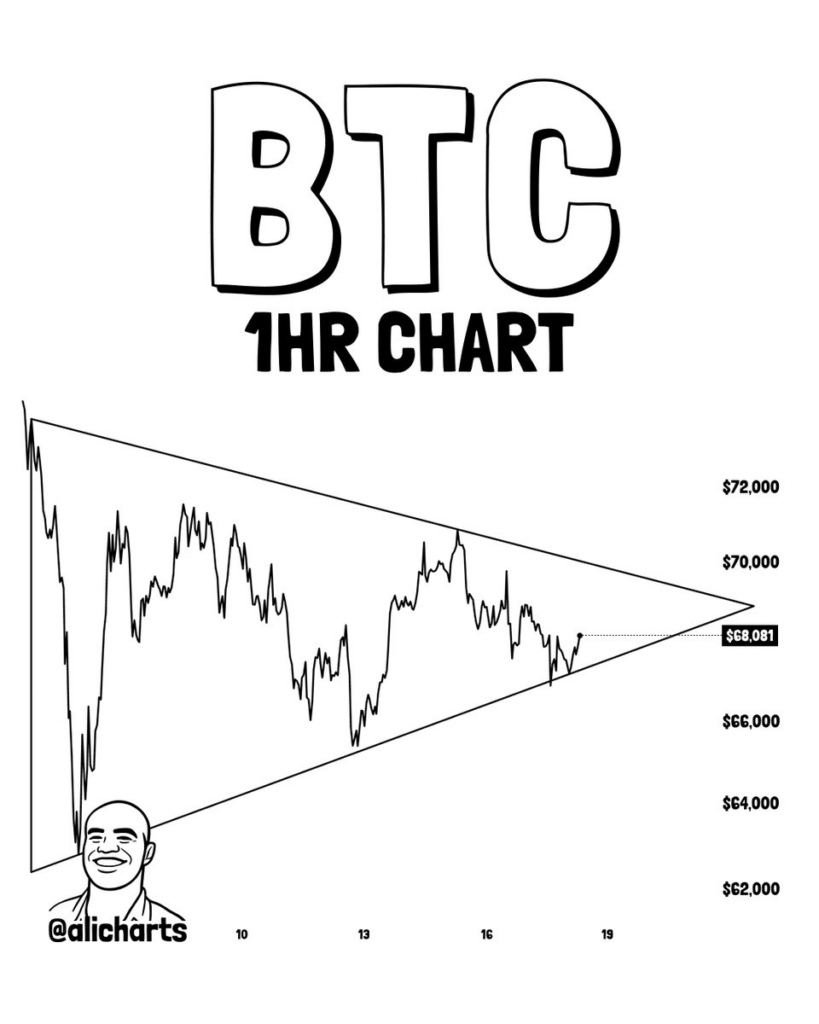 Bitcoin price analysis chart. Source: Ali Martinez
According to the outlook, Bitcoin is forming lower highs near the $70,000 to $72,000 region while establishing higher lows above roughly $64,000, creating converging trendlines.
Such compression typically reflects declining volatility and a balance between buyers and sellers before a decisive move.
A confirmed breakout above the upper trendline could open the door to an advance toward the $78,000 area, representing an approximate 15% upside from current levels.
Conversely, a breakdown below the lower boundary may trigger a move toward the $58,000 zone, marking a similar percentage decline.
Bitcoin’s sustained struggle below $70,000
As things stand, Bitcoin continues to struggle, remaining about 50% below its October 2025 all-time high of $126,000. Since the start of 2026, the asset has declined over 20%, with February alone posting an approximate 28% drop.
Attempts to hold above the key $70,000 level have repeatedly failed, leading to pullbacks into the mid-$60,000s and only tentative stabilization near current prices.

The Economics of the Global Online Gambling Business – How Big is it Really?
The global online gambling business is huge. Estimates placed the 2025 market at being worth around $78 billion a year, … Continue reading
Featured Sponsored Feb 16, 2026
The weakness reflects several converging factors. Futures open interest has plunged more than 55% from its October peak in one of the sharpest deleveraging episodes of recent cycles. Funding rates have turned negative, and liquidations reached several billion dollars earlier this month as traders cut leveraged exposure.
On the other hand, spot Bitcoin ETFs have seen sustained net outflows, signaling a rotation toward perceived safe havens such as gold during a broader risk-off environment.
Macroeconomic headwinds persist, with inflation around 2.4%, the Federal Reserve holding rates near 3.75% under a higher-for-longer stance, ongoing geopolitical tensions, and Bitcoin’s strong correlation with equities intensifying selling during market pullbacks.
Bitcoin price analysis
By press time, Bitcoin was trading at $67,226, having modestly dropped by almost 1% and up 0.3% on the weekly timeframe.
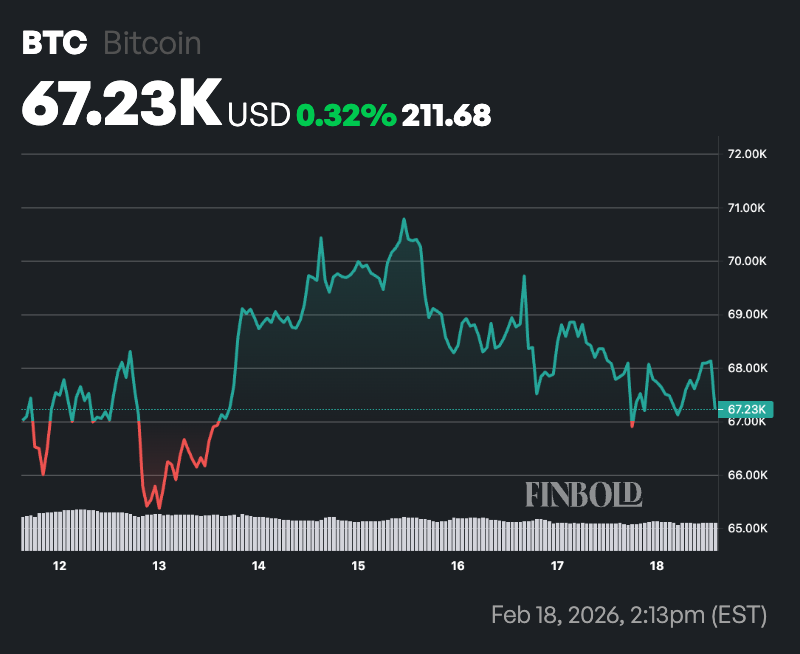 Bitcoin seven-day price chart. Source: Finbold
Technically, Bitcoin remains below its 50-day SMA at $83,803 and well under the 200-day SMA at $100,301, signaling continued bearish momentum. The large gap beneath the 200-day average highlights a broader downtrend and weak long-term sentiment.
Meanwhile, the 14-day RSI at 35.78 is neutral but nearing oversold levels. Although not yet below 30, it indicates soft buying pressure and limited upside momentum, leaving the structure fragile unless RSI strengthens and price reclaims the 50-day SMA.
Featured image via Shutterstock